 Stop Gaz de Schiste - France - Ardèche
Accueil > Boite à outils "Scientifique" > Shale Gas in the context of conventional energy
Shale Gas in the context of conventional energy
jeudi 22 septembre 2011
The Current, international upsurge of feeling against Shale Gas Extraction ; from France to Australia, New Zealand and the UK, demonstrates our need to engage in the totality of the current energy debate. It is becoming necessary that we, as individuals, understand the deeper issues involved in order to properly begin the process of an informed and organised energy descent.
This article is going to contextualise Shale Gas by presenting four major fossil fuel resources ; coal, oil, gas and uranium. The two principles we will need are first ; the model of resource production, and second the energy return on investment [EROI] of these resources, i.e. the calculation of how much total energy is produced, against the total energy used in production.
1 Modelling Resources
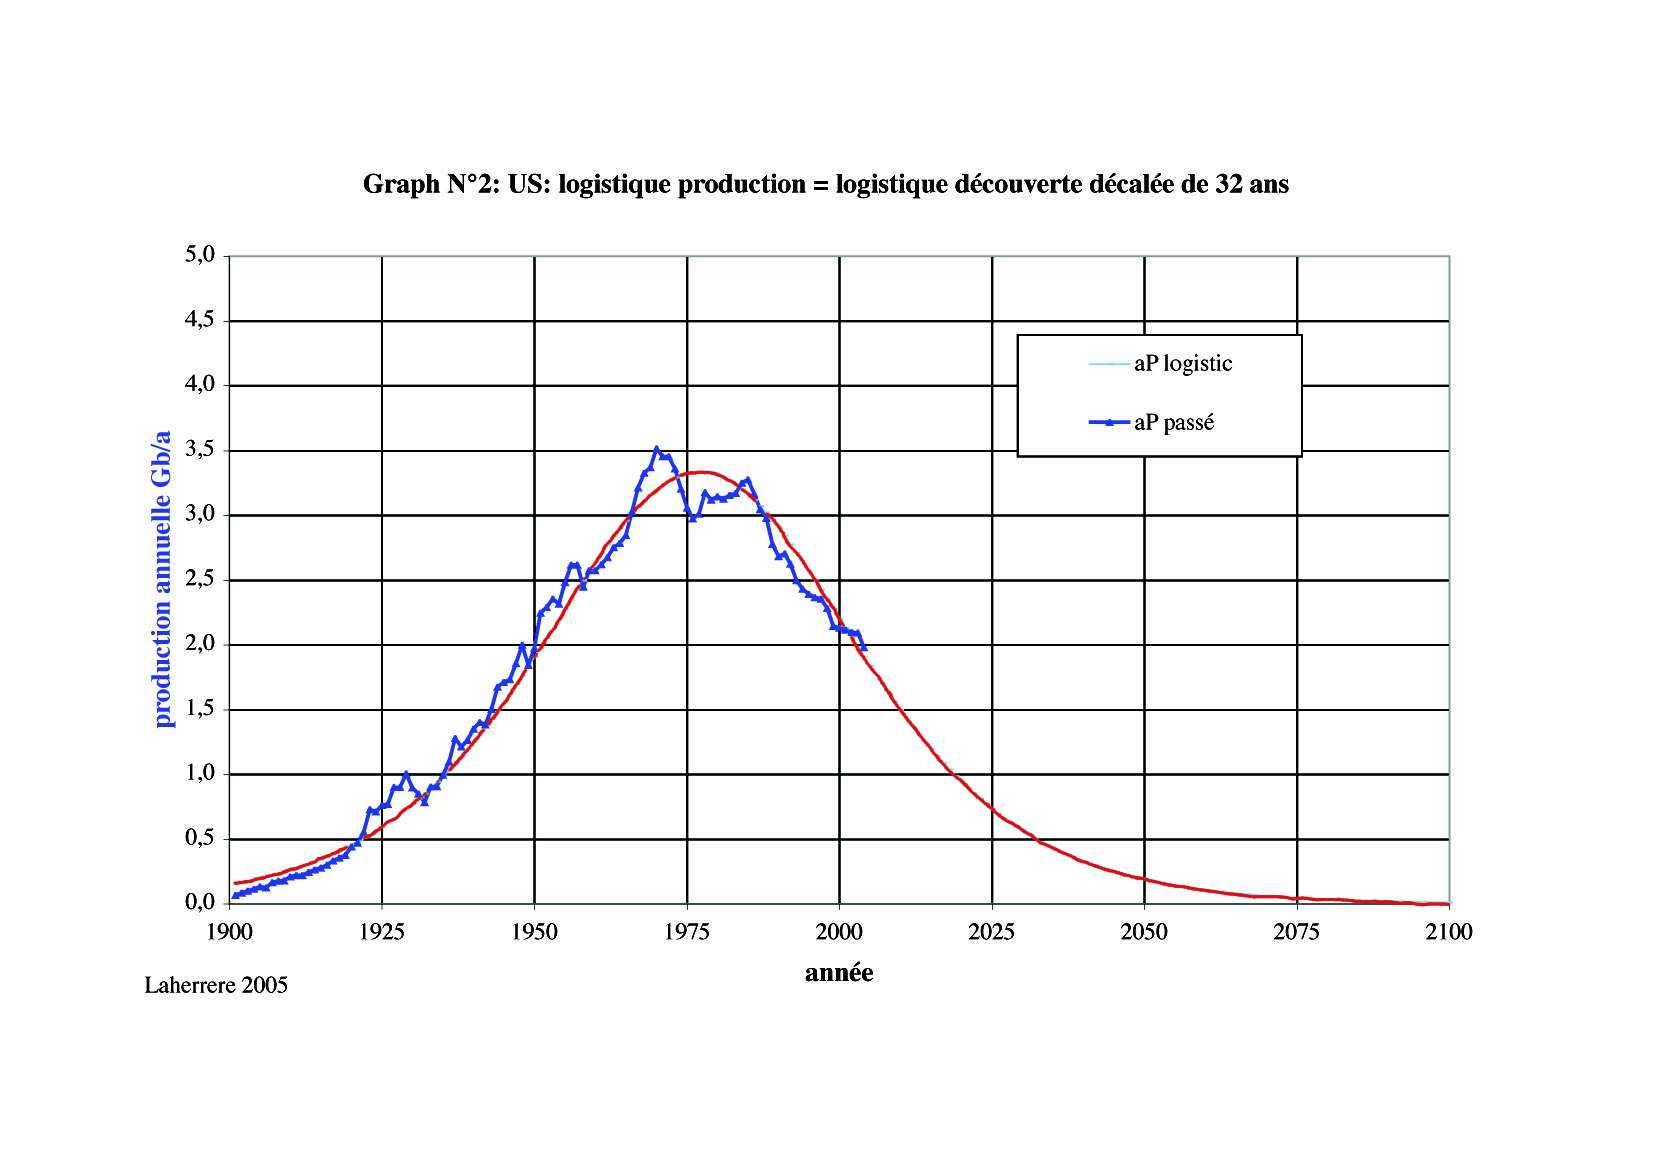
In 1956 the geophysicist Marion King Hubbert proposed a mathematical model to describe the dynamics of oil production. The resulting parabola describes a rise in production culminating in a peak, followed by an inexorable decline as wells begin to dry up.
The figure below is a comparison between the mathematical model (red) and the real oil use for the USA (blue).
Of course, Hubbert’s modelling system doesn’t only work for oil ; the other fossil fuels accord to the same laws.
_Below is a second example where we see the different fossil fuel resources of the UK. (Note the decline in coal and in the wells of oil and gas in the North Sea.)
2 Energy return on investment and its Evolution
Precisely as we saw in the preceding article, the EROI is starting not to add up ; less energy is being produced than is being used in extraction and production. The increasing difficulties of extraction, for example the current need to inject gas or water into deeper and deeper wells to arrive at the same pressure, indicates a decline in the EROI of Fossil fuels. When the energy invested surpasses the energy recuperated you would think that it would become useless to persevere.
_It is important to note the EROI of Fossil Fuels can only worsen over time, whereas the EROI of renewables remains at a constant as long as the sun continues to shine ; we can reasonably hope for about four billion years ! The same holds true, in effect, for the wind, the tides of the sea, as well as the various energies derived from the sun.
References (EROI) :
Shale Gas EROI
IRIS Report : page 4, chapter « Gaz de schiste et coûts énergétiques »
Shale Gas—Abundance or Mirage ?
Humanité : auto défi : Chapitre « EROI, déclin apparent et déclin réel »
Gaz de schiste : la garantie de notre indépendance énergétique ?
Conventional Oil
In our exploration of the circumstances surrounding Shale gas, the current global situation of oil merits a word. The International Energy Agency (IEA) announced at the end of 2010 that global peak oil had been reached in 2006.
But then again the date of global peak oil has a long history of debate. On the side are the pessimists, like the Iranian geo-physician Ali Samsam Bakhtiari who predicted the date as 2006-7 and on the other side the optimists, who generally plump for a date around 2060.
The reality seems to be playing out more according to the predictions of pessimists, and it is interesting to note that the pessimists tend to be scientists, whereas the optimists tend to be economists...
Here is a figure of global production.
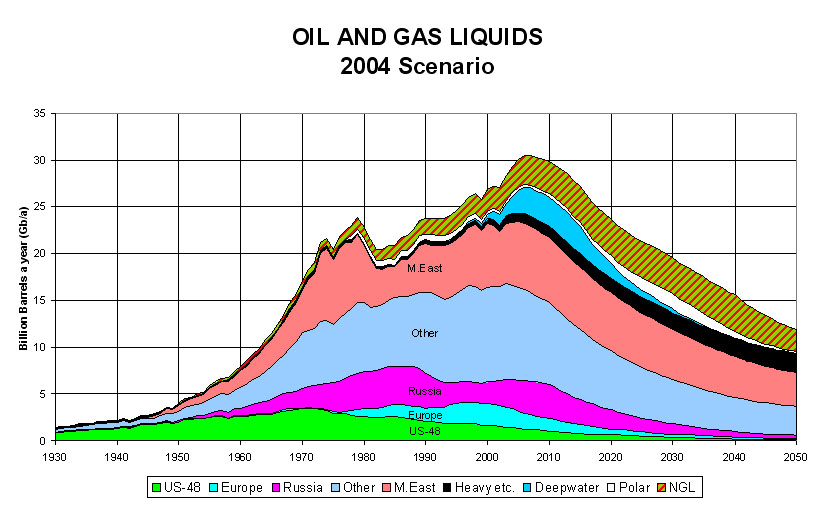
This presentation of the peak of production just goes to show how perverse some of the arguments surrounding this issue are ; we frequently hear that “there are still forty years of oil.” And indeed, that assertion may well be right, as far as it goes. The question, indeed the problem, is not ascertaining how long we have left, but rather how the decline is going to affect our lives.
The combination of consequences predicted insist that we do not continue in the same lifestyles just until there are three drops of oil left in forty years…
Some given figures for 2006, the year of peak ;
![]() Out of 48 highly productive countries 33 are in decline
Out of 48 highly productive countries 33 are in decline
![]() In 98 producing countries 63 are in decline
In 98 producing countries 63 are in decline
The indicators are, for example, how many countries have passed their actual peak-
![]() 1970s – 10 countries
1970s – 10 countries
![]() 1980s – 12 countries
1980s – 12 countries
![]() 1990’s – 14 countries
1990’s – 14 countries
![]() 2000-2005 – 14 countries
2000-2005 – 14 countries
There is not the space to go into the whole history of oil production, though you can find the whole story here (in french) page 8, chapter “Le rendement énergétique et l’énergie nette”.
Conventional Oil’s References :
The Party’s Over Richard Heinberg
Pic du pétrole et pic du gaz Patrick Brocorens
peak-oil : an analysis by german military
US military warns oil output may dip causing massive shortages by 2015
Short cartoon (2 minutes) (How will you ride the slide ?)
Conventional Gas
The issues surrounding conventional gas can leave us confused, in effect the info on exploration are not well understood.
The productive countries are keeping their cards close to their chests and the exact date of peak gas is difficult to determine. Ali Samsam Bkhtiari has predicted the same date for that of peak oil. Whether or not this estimate is correct is hard to be sure.
What we do know is that the decline after peak gas will be a very important time for all. To give us an idea of gas production works we can use the image of using up a gas bottle. When pressure is sufficient, ie when the bottle or well is full then gas can be extracted without a problem. We get some indication that it is beginning to empty when… help !
Taking account of this image then, if we are really to get to grips with the peak gas date, we will need to know the pressures on all the remaining wells. At the moment we have none of the necessary figures to make an accurate prediction.
Conventionnel gas references :
Peak oil and peak gas (french) Patrick Brocorens
Uranium
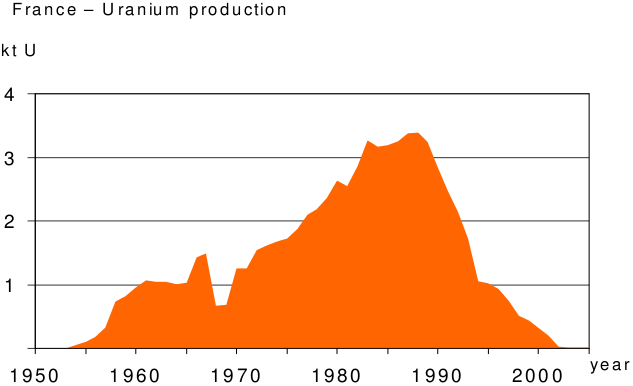
A report from a German study group (reference below) shows the gravity of the Uranium situation, especially for countries like France, those heavily dependant on Nuclear energy. The conversation surrounding nuclear energy lets us believe that we have unlimited supplies of uranium at our disposal but, of course, uranium is also a fossil fuel, like coal or gas and will also arrive at a peak in production. Below are two charts showing the reality of the situation.
First see the parabola of uranium production in France ; the curve shows that the idea of energetic independence initially offered by nuclear power is, now, a long time past. The chart shows forty years of exploitation, with the rapid decline of the last ten.
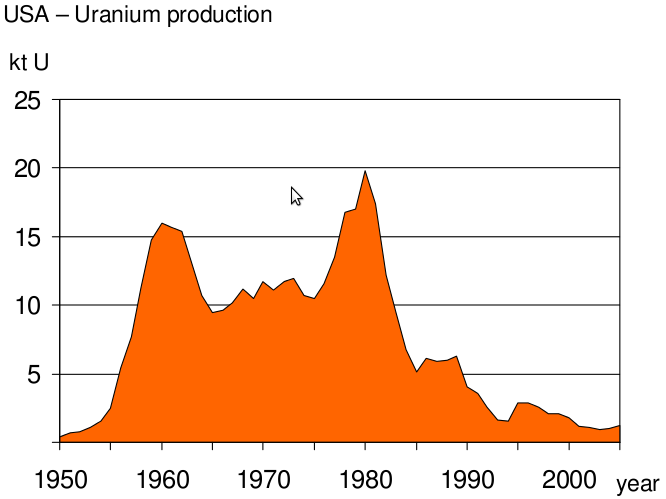
Next- the USA’s uranium production is noticeably different – it has two peaks, representing two periods of discovery and exploitation. Equally it shows fifty years of discovery followed by ten years of steady decline.
If we look closer at production and consumption for 2006 for example we find ;
![]() Production 42000 per year,
Production 42000 per year,
![]() Consumption 67000,
Consumption 67000,
A total defecit of 25000 that year.
This defecit is completed by the civil and military stocks – some 200000 in 2006. At this rate they will be exhausted by 2012-2015.
We can also note that in January 2003 and april 2007 the price of “yellow cake” (oxide of uranium) passed 22 249$/kg
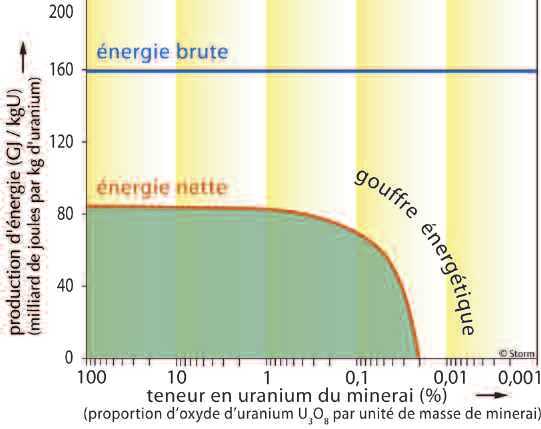
The huge depletion in Uranium stocks and resources is not the only worry for the industry ; the EROI is equal between product and cost, in other words it is necessary to put in as much as you get out. According to by Jan Willem Storm van Leeuwen of GIEC and by the Oxford research group, the EROI of Uranium is essentially dependant on the quality of the minerals in the Uranium. To understand the true EROI of uranium usage we must include in the calculation the energy for extracting the uranium and for purifying the raw material ; in a poor mineral we will use much more energy extracting 1kg of uranium than from a rich source.
The important question is at what point the necessary energy for extracting uranium exceeds the energy produced. The limit under which it becomes useless to extract uranium is between 0.02% and 0.01%. Unconventional sources of uranium like sea water, sometimes elevated to the status of holy grail in terms of energy resources, is infact way below the sensible limit (0.0000003%). The EROI of uranium fares very badly after 0.1% and the energy watch group (EWG) suggest that 2/3 of the worlds remaining resources is of a quality lower than 0.06.
Uranium’s references :
uranium’s report from Energy Watch Group (EWG)
Uranium’s EROI
Coal
Like Uranium the EWG has published a report on coal. The researchers have explored the resemblance between coal on the one hand, and oil and gas on the other. We know here to that the announced figures of global reserves are rough estimations.
Strangely, paradoxically even, the implications are mostly concerned with oil. Peak coal may have occurred in China, and their oil needs and demands are therefore set to rise significantly. More and more troubles grow around the question of supply and demand, which will have considerable conotations for the price.
Coal references :
EWG Report Coal from Energy Watch Group (EWG)
The peak oil crisis : 2011 – a pivotal year ?).
And Now ?
We can see that the situation is not an easy one. Nor is it relusiante ????
That’s probably why the oil companies look to solutions like shale gas- solutions which allow them to keep their hands on the profits. But it is also clear that these pseaudo solutions are by no means a prolongation of the timeline we have described, infact they more likely signal an acceleration towards disaster if the EROI of Shale gas is negative and if it definitively pollutes the earth.
We may reach a point where everyone asks why nothing was done to avert the coming disaster. It will be necessary that the people take their destiny into their own hands. Sustainable collective and local solutions on the one hand, and disallowing our representatives from imposing their pseaudo-solutions on the other, seem like the only course to follow.
Great thanks to Andrew Marshall for translation.

- Diaporama pour réunions publiques
- Diaporama présenté lors de réunions en Ardèche